


Strip Chart Meaning: Definition, Uses, and How It Works
Introduction
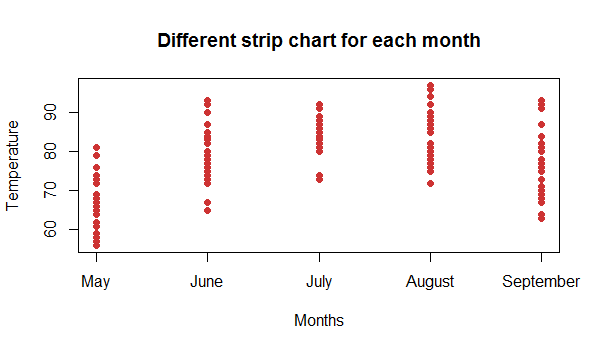
A strip chart is a type of graph used to record and display changes in a measurement over time. It is commonly used in science, engineering, manufacturing, medicine, and industrial processes where continuous monitoring is important. A strip chart typically shows time on one axis and the measured value on the other, allowing users to see trends, fluctuations, and unusual changes.
The term comes from traditional recording devices that used a long strip of paper to continuously record data. Modern strip charts are often digital, but they follow the same basic concept.
What Does Strip Chart Mean?
The strip chart meaning refers to a continuous graphical record of data, usually collected over a period of time. Instead of showing individual measurements in a simple table, a strip chart connects measurements visually so that changes can be identified quickly.
For example, a temperature-monitoring system might use a strip chart to show how temperature changes throughout a day. If the temperature suddenly rises or falls, the change can be seen immediately on the chart.
Strip charts are particularly useful when the timing of an event is important.
How Does a Strip Chart Work?
A strip chart records measurements continuously or at regular intervals. Traditionally, a pen moved across a roll or strip of paper while the paper moved at a constant speed.
The basic process includes:
- A sensor measures a physical quantity.
- The measurement is sent to a recording device.
- The device plots the measurement on a moving chart.
- The resulting line shows how the measurement changes over time.
In modern systems, software replaces the physical pen and paper. Data can be displayed on a computer screen and stored electronically for later analysis.
Main Features of a Strip Chart
A strip chart generally has several important features.
Time-Based Recording
Time is usually represented along the horizontal axis. This makes it easy to determine when a particular change occurred.
Continuous Data Display
Strip charts are designed to display a sequence of measurements over time. This makes them useful for monitoring processes that change continuously.
Visual Trends
A user can quickly identify whether a measurement is increasing, decreasing, stable, or fluctuating.
Event Detection
Sudden spikes, drops, or unusual patterns can help identify problems or important events.
Common Uses of Strip Charts
Strip charts are used in many different fields because they provide an easy way to monitor changing conditions.
Industrial Processes
Factories may use strip charts to monitor temperature, pressure, speed, flow rate, and other operating conditions. A sudden change in the recorded value can indicate that equipment needs attention.
Scientific Research
Scientists can use strip charts to record experimental measurements. For example, researchers may monitor electrical signals, temperature changes, or chemical reactions over time.
Medical Applications
Medical monitoring equipment can display continuously changing signals. Some traditional medical recording systems have used strip-chart-style outputs to document physiological measurements.
Environmental Monitoring
Strip charts can be used to track environmental measurements such as temperature, humidity, air pressure, or water levels.
Electrical and Electronic Systems
Engineers may use strip charts to monitor voltage, current, frequency, or other electrical signals. The visual record can help identify irregular behavior.
Strip Chart vs. Regular Graph
A strip chart is a type of graph, but its main purpose is usually continuous or time-based monitoring.
A regular graph might compare sales between different products or show population figures across several years. A strip chart, in contrast, is often used to observe a measurement as it changes from moment to moment.
For example, a line graph might show average temperature for each month. A strip chart could show temperature continuously throughout a 24-hour period.
Strip Chart vs. Line Chart
Strip charts and line charts can look very similar because both can display data using connected lines. The main difference is their typical application.
A line chart is often created to communicate data clearly to an audience, while a strip chart is commonly associated with continuous monitoring and recording.
In practical situations, the terms can sometimes overlap, especially when digital software uses “strip chart” to describe a scrolling time-series display.
Advantages of Strip Charts
Strip charts offer several benefits.
Easy to Understand
A visual line makes it easier to recognize patterns than reading a long list of measurements.
Good for Continuous Monitoring
Strip charts are especially useful when data must be observed over an extended period.
Shows Timing
Because the chart is based on time, users can determine when changes occurred.
Helps Identify Abnormal Conditions
Sudden peaks, drops, or unusual fluctuations can be detected quickly.
Provides a Historical Record
Traditional paper charts and digital recordings can provide evidence of what happened during a particular period.
Limitations of Strip Charts
Despite their usefulness, strip charts have some limitations.
Traditional paper-based systems require physical supplies and maintenance. They can also take up considerable space when data is recorded over long periods.
Digital strip charts solve many of these problems, but large amounts of recorded data can still require storage and careful analysis.
Another limitation is that a strip chart may show that something changed without immediately explaining why it changed. Additional investigation may be necessary to determine the cause.
Examples of Strip Chart Data
Imagine a machine that must operate at a temperature of 80°C. A strip chart could continuously record its temperature.
If the line remains close to 80°C, the machine is operating consistently. If the line suddenly rises to 95°C, the chart provides a clear visual warning that something unusual has happened.
Similarly, a factory could use a strip chart to monitor pressure in a pipeline. A sudden pressure drop could indicate a leak, equipment problem, or change in operating conditions.
Digital Strip Charts
Modern technology has made strip charts more flexible. Instead of using paper and a mechanical pen, computers and monitoring systems can display data in real time.
Digital strip charts may allow users to:
- Zoom into specific time periods
- Store historical measurements
- Add multiple data channels
- Set warning thresholds
- Export data for analysis
- Display live measurements
- Compare different signals
These features make digital strip charts valuable in modern industrial and scientific environments.
Why Are Strip Charts Important?
The main value of a strip chart is its ability to turn continuously changing measurements into an understandable visual record.
When hundreds or thousands of measurements are collected, looking at individual numbers can be difficult. A strip chart presents those measurements as a pattern, making it easier to recognize trends and unusual behavior.
This can support faster decision-making, troubleshooting, quality control, and process improvement.
Frequently Asked Questions
What is a strip chart in simple words?
A strip chart is a graph that continuously records how a measurement changes over time.
Why is it called a strip chart?
The name comes from traditional recording machines that plotted data on a long, moving strip of paper.
What is a strip chart used for?
Strip charts are used to monitor changing measurements such as temperature, pressure, voltage, speed, and other variables.
Is a strip chart the same as a line graph?
They can look similar, but a strip chart is typically associated with continuous or time-based monitoring, while a line graph can be used for many different types of comparisons.
Are strip charts still used today?
Yes. Although paper-based recorders have become less common, digital strip charts are widely used in monitoring and data-acquisition systems.
Also Read:Lorice Washington: Life, Faith, Career, and Family Background
Conclusion
The strip chart meaning is simple: it is a graphical method for recording and monitoring data as it changes over time. From traditional paper recorders to modern digital displays, strip charts have remained useful because they make continuous data easier to understand.
Whether used in a laboratory, factory, medical environment, or monitoring system, a strip chart provides a clear visual record of trends, fluctuations, and important events. Its ability to show both what changed and when it changed makes it a valuable tool for analyzing continuously changing data.